As highlighted in Part 1, observability aggregates, correlates, and analyzes a steady stream of data (e.g., application, third-party software, infrastructure data) to effectively monitor and troubleshoot applications to meet business requirements – be it business continuity, customer experience, service level indicators (SLIs) or service level objectives (SLOs).
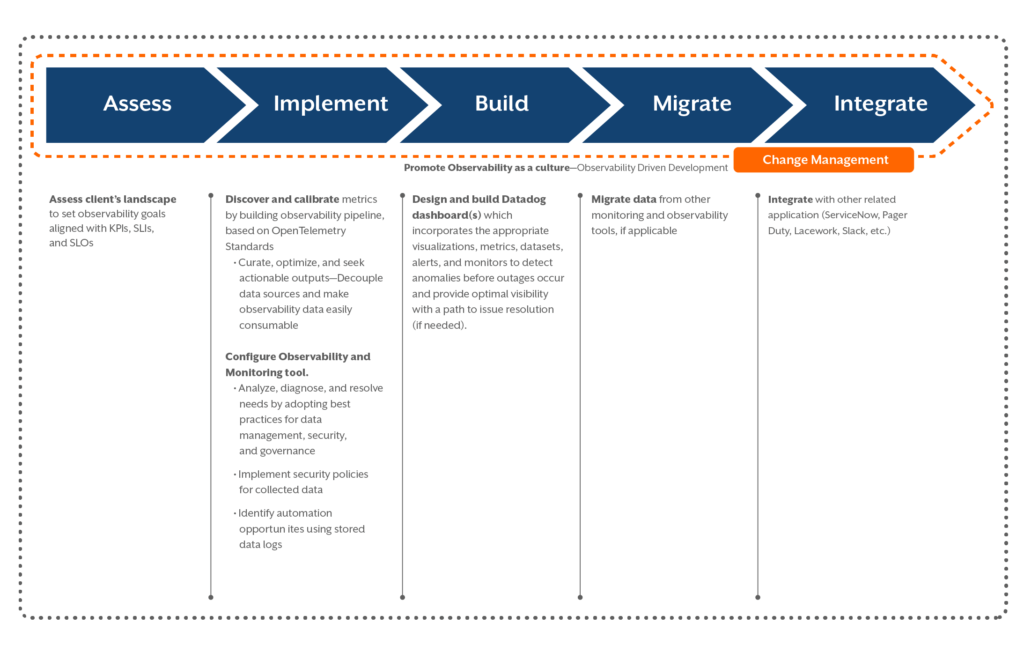
In this blog, we will discuss how Infinitive’s observability framework is used to implement an observability platform using Datadog, a monitoring and analytics tool for IT and DevSecOps teams. To establish an observable environment, organizations need to apply a holistic change management strategy that is exemplified by the following five steps:

Assessment Phase:
- Assess the client’s landscape to set observability goals that are aligned with key performance indicators (KPIs), service level indicators (SLIs), and/or service level objectives (SLOs)
- KPIs (e.g., performance, usage) are a function of system implementation or architecture. KPIs may change only if system implementation or architecture changes.
- SLIs (e.g., user expectations metrics) is a function of user needs.
- SLOs are SLIs with tolerance thresholds that denote acceptable levels of service.
Implementation Phase:
- Discover and calibrate metrics (e.g., latency, traffic, error rates) by building an observability pipeline, based on OpenTelemetry Standards.
- Curate, optimize, and seek actionable outputs – separate data sources and make observability data easily consumable
- Configure observability and monitoring tools.
- Analyze, diagnose, and resolve needs by adopting best practices for data management, security, and governance
- Implement security policies for collected data
- Identify automation opportunities using stored data logs
Building Phase:
- Design and build a Datadog dashboard(s). The dashboard(s) should include the appropriate visualizations, metrics, datasets, alerts, and monitors to detect anomalies before outages occur and provide optimal visibility with a path to issue resolution.
- To collect and publish monitoring metrics to its SaaS backend, Datadog agents need to be run on the local environment and used for monitoring both classic and microservices-based environments.
- Build real-time interactive dashboards to monitor metrics, traces, logs, etc.
- Proactively monitor critical user journeys and visualize user experience data in one place
- Correlate frontend performance with business impact using user experience metrics
- Implement user access, as required, using SAML and multiple programmatic access. Use custom user roles to provide fine-grained access.
- Generate and use custom metrics, by applying Datadog’s rich set of options.
- Use tags to group and filter metrics data.
- List events, which can be forwarded to multiple channels like Slack and PagerDuty through event stream dashboards.
- Leverage Datadog’s features that support both host- and container-level monitoring, including serverless resources like AWS Lambda.
- Use monitors and alerts, as required.
- For log management, leverage Log Explorer for active log searches and public cloud storage services for storage. Explore and analyze logs from all your services, applications, and platforms.
- Trace requests from end to end across distributed systems with application performance monitoring (APM).
- Detect threats in real-time across your applications, network, and infrastructure with security monitoring.
Migration Phase:
- Migrate data from other monitoring and observability tools, if applicable.
Integration Phase:
- Integrate with other related applications (ServiceNow, Pager Duty, Lacework, Slack, etc.).
- With Datadog’s out-of-the-box integrations and custom checks, organizations can build integrations to create a holistic observability platform. Organizations can aggregate metrics and events across the entire IT landscape with Datadog’s 450+ built-in integrations.
- In addition, Python can be used to build Datadog APIs. Anything that can be done through Datadog user interface (UI) can be performed programmatically using an API.
- Using monitoring standards like StatsD and/or Datadog REST API libraries, Datadog can be integrated with network devices and custom applications.
Datadog’s observability platform unifies monitoring and connects information across the IT landscape (as listed below but not limited to):
- Applications (build hooks or API endpoints in the application)
- Platforms (platforms range from databases to messaging systems to BI/reporting tools. Most of them provide an interface, mainly via the REST API, that can be leveraged to implement plugins on the Datadog platform)
- Infrastructure (servers, storage devices, load balancers, etc.)
- Last mile check, if needed. (e.g., Catchpoint)
- Security monitoring (e.g., vulnerability of the application system/infrastructure components)
- Business-level alignment (e.g., alignment with the business goals)
Read our blog about Datadog best practices for observability implementation.
At Infinitive, we drive development through a change management process to establish observability as a culture. As a Datadog Gold Partner, Infinitive has implemented observability platforms for several clients across multiple industries to deliver maximum ROI while minimizing time to value. Our proven observability framework methodology will help your organization mitigate issues while increasing its business agility, revenue, and cost savings.
Our next blog will focus on sustaining observability at scale by sharing salient business use cases. Are you wondering how to get started? Infinitive can work with you to deliver results in 6 weeks or less. For more information on how to implement a sustainable observability solution, contact us today.
Upcoming Observability Events:
Infinitive Live: Observability!
Join Infinitive on February 2nd, 2023 at 10:00 am ET to learn more about observability and how your organization can gain deeper visibility into your complex systems for faster issue identification and resolution.
Register HERE