Get More from Your Data with Graph Technology
Your company is teeming with data, but do you have the tools to use it to its fullest extent?
Business leaders are always looking for ways to leverage data to improve decision-making. Often, though, desired insights are out-of-reach due to a lack of context and inability to join islands of data in a meaningful way. Relational databases will only get you so far. Enter graph technology.
A “graph” is a data structure that focuses on the logical relationships among data entities. Graph analytics (a.k.a., network analysis or link analysis) is used to explore these relationships to gain insights. Some well-known graph databases are Neo4j, AWS Neptune, Oracle Spatial, and Franz AllegroGraph, which are optimized to support this relationship structure and even have specialized query languages such as Gremlin, Cypher or SPARQL.
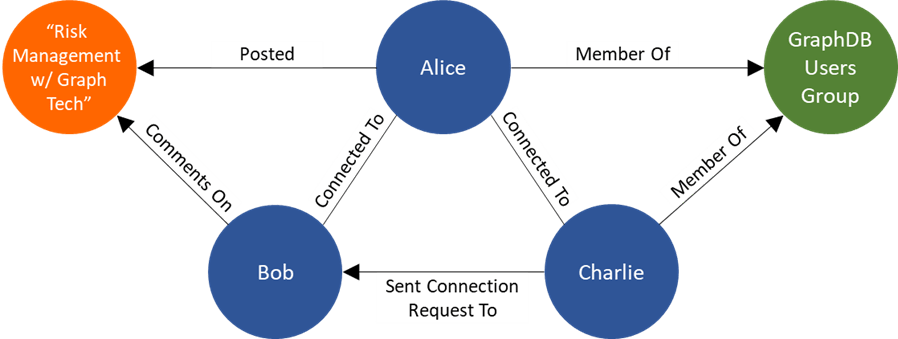
Picture the data behind LinkedIn or any social network, which is perfectly suited for a graph structure. Users are connected to other users at many levels in a vast network. They also belong to groups, work for companies, and share posts – and these posts can be commented on, liked, celebrated, loved, etc. Each of these connections and actions between entities can be represented in a graph structure. Here’s a simplified example of what that structure might look like:

Why Graph Technology
The power of graph technology lies in its flexibility, intuitive structure, and unique relationship-based insights. Graph databases excel at linking data from disparate data sources, making it easy to create and expand a connected view of entities (known as nodes or vertices) such as customers, employees, products, transactions, etc. The relationships between entities (known as edges or links) typically reflect a subject>predicate>object structure. The relationships can also be directional as illustrated above (e.g., Bob Comments on a post).
Graph analysis can provide unique insights by focusing on these relationships, looking at patterns and the nature of the connections. For example, Centrality is a core concept of graph analytics and is used to evaluate the relative importance of entities in the network. Centrality-based analysis considers how many connections an entity has, whether they are inbound vs. outbound relationships, or whether an entity is in the shortest path between two others.
Graph analytics is so powerful that Gartner predicts a huge growth for the technology coming years. In a recent study, the research group predicted not only that data and analytics would become a core business function in 2021 but that graph technologies would be used 80% of the time by 2025, up from 10% in 2021.
Graph Technology in Action
Graph technology is a great choice for many different analytics use cases and can be utilized in virtually any industry or function. Below are just a few examples of the insights that can be gained:
- Business Continuity Management: Develop a holistic view of potential risks associated with the many dependencies that comprise a business continuity plan.
- Fraud Detection: Explore suspicious patterns of activity or connect bad actors/fraudulent activity with other accounts, transactions and customers to provide real-time or forensic fraud alerts.
- Recommendation Engine & Product Recommendation System: Storing customers click-through data, purchase history, or their interests in a graph database allows a business to orchestrate campaigns to provide real-time recommendations to their consumers.
- Application Resiliency Risk: Identify applications at risk due to factors such as tech incidents, change management control gaps, resiliency test results, audit finding or dependencies on applications with related risk factors.
- Human Resources: Build culture and improve retention by identifying internal influencers, skills, career paths, and other factors that lead to successful, effective, and happy employees.
How Infinitive can Help
Infinitive consultants have the know-how and real-life experience to help you leverage graph technology and make the most of your data. For example, we recently worked a Top 10 Bank’s Audit group to develop proofs-of-concept to identify potential areas of risk related to access management and business continuity management.
Infinitive can also take graph analysis to the next level by applying artificial intelligence to incorporate unstructured data in your graph, and machine learning to further refine application and model outputs.
Whether you are exploring new customer insights, strengthening risk management capabilities, optimizing processes or whatever is important to you, Infinitive can turbo-charge your journey. From building proofs-of-concept to hardening an established model, Infinitive can help. Reach out today and let’s start the conversation.