
What does Sherlock Holmes, Spiderweb, LinkedIn and Facebook all have in common? And what about Comcast, Airbus, Toyota, and eBay? The former linkage is, well, all about linkages. If you remember, Sherlock started his investigations by connecting the dots between each clue, ultimately solving the case by employing a linkage-based data model. In the present day, when applied to data, this representation is known as a Graph Database (GDB) or a GraphDB. In fact, rather than solving cases, these companies have been using GDBs to produce insights which drive revenue and reduce costs. So let us put on our detective hats, grab our cob pipe, and uncover the power that GDBs will bring to your company.
Why Should I Care About GDBs?
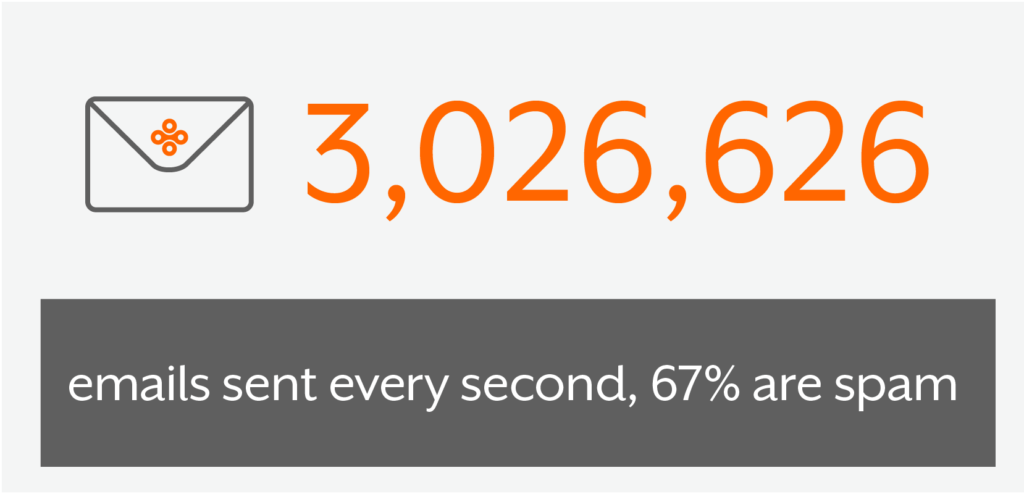
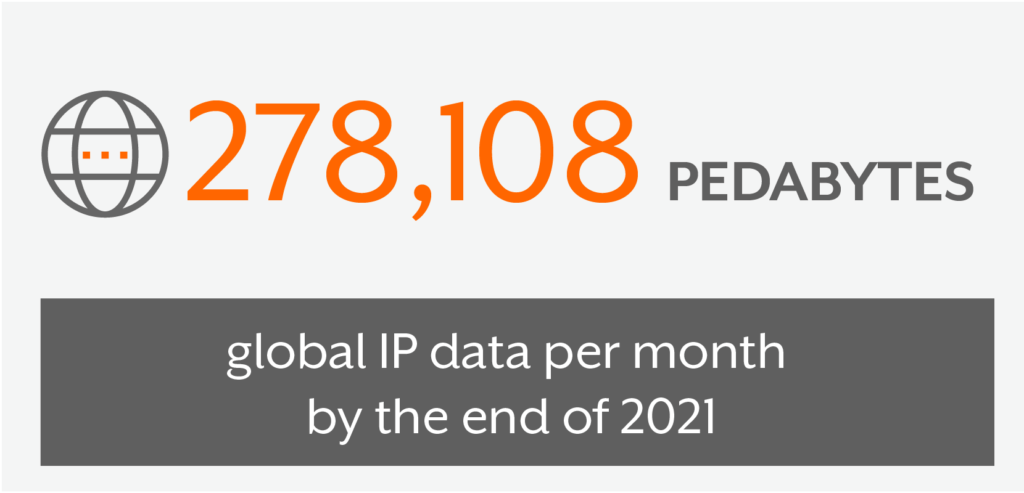
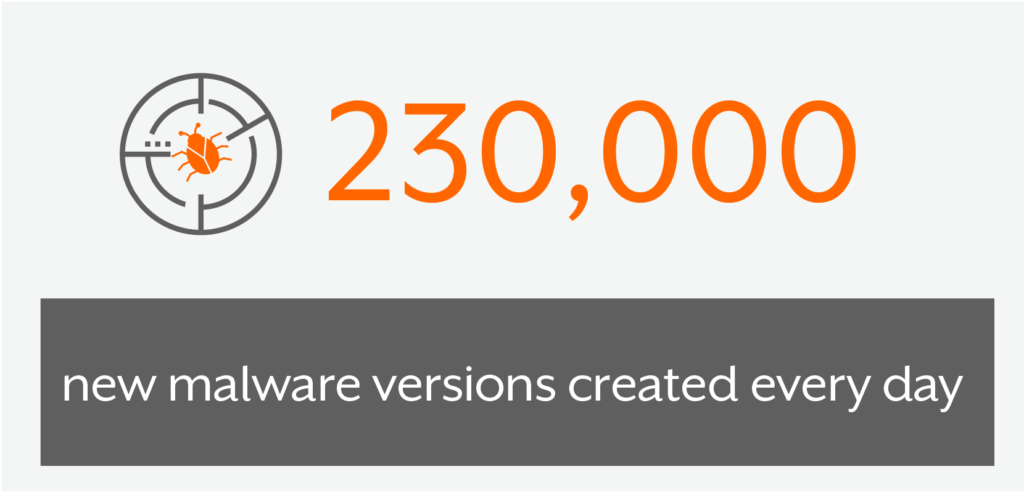
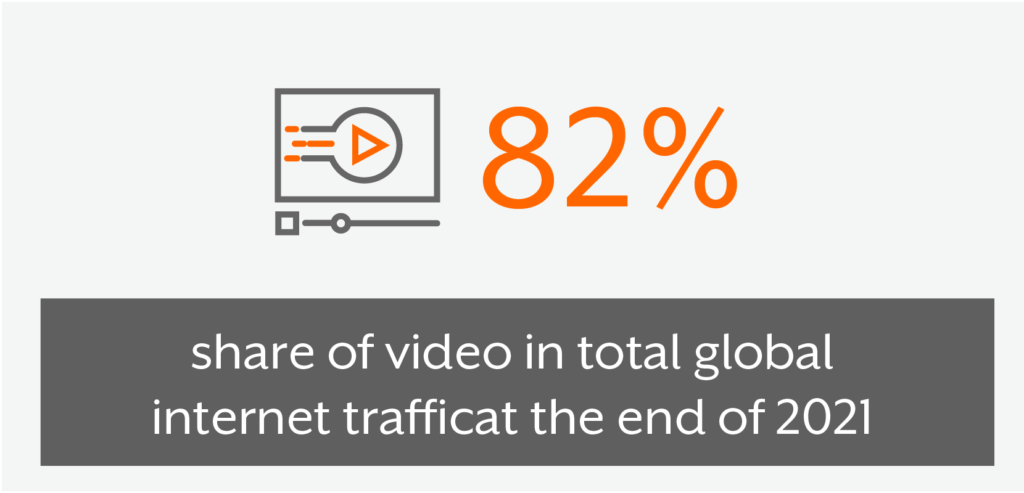
If you are dealing with large volumes of data, chances are you should. Here are 3 quick reasons why dealing with large volumes of data is imperative in today’s world:
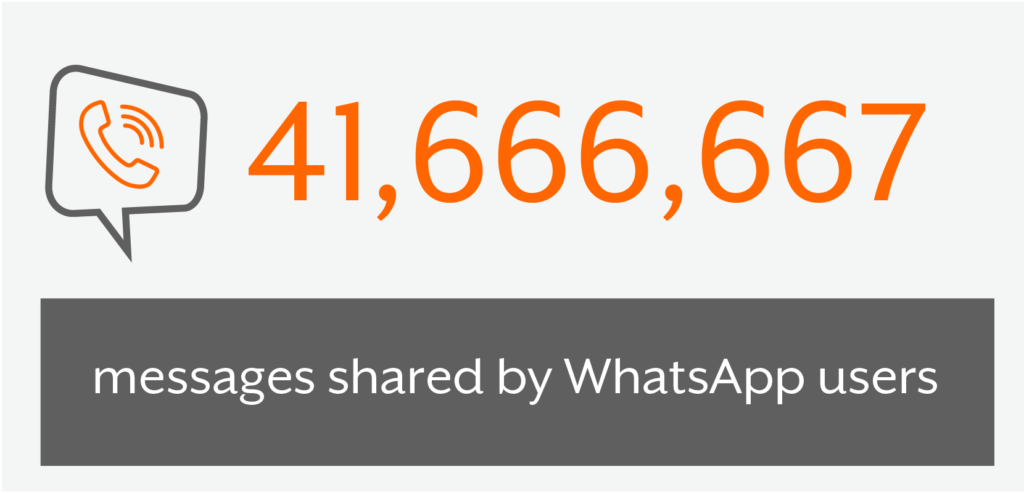
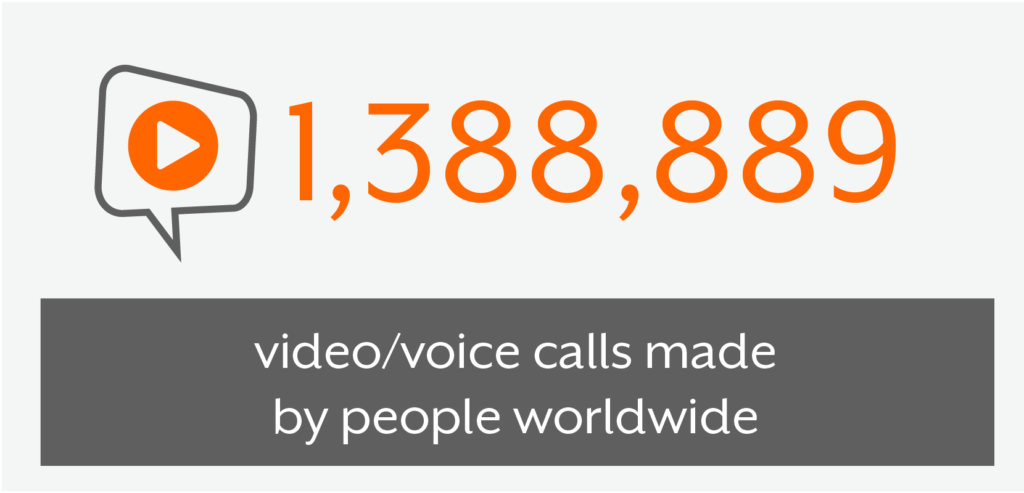
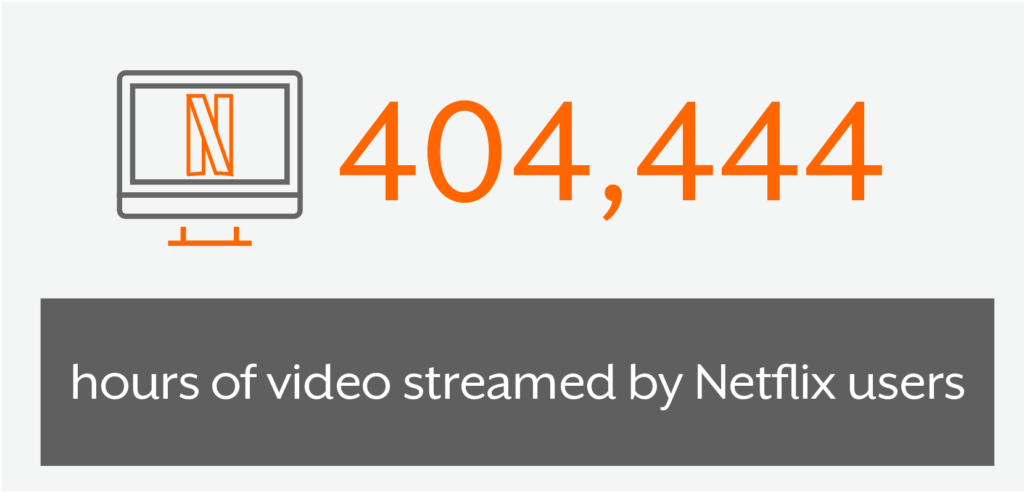
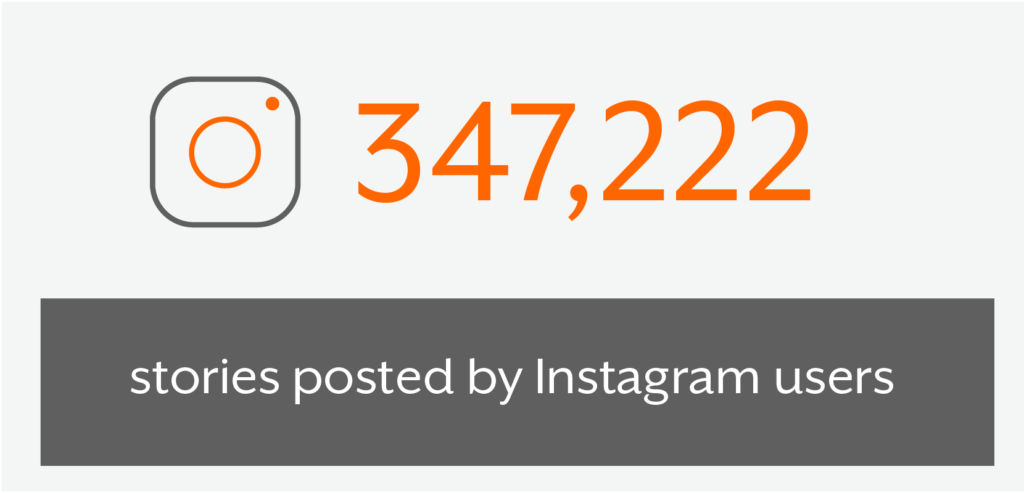
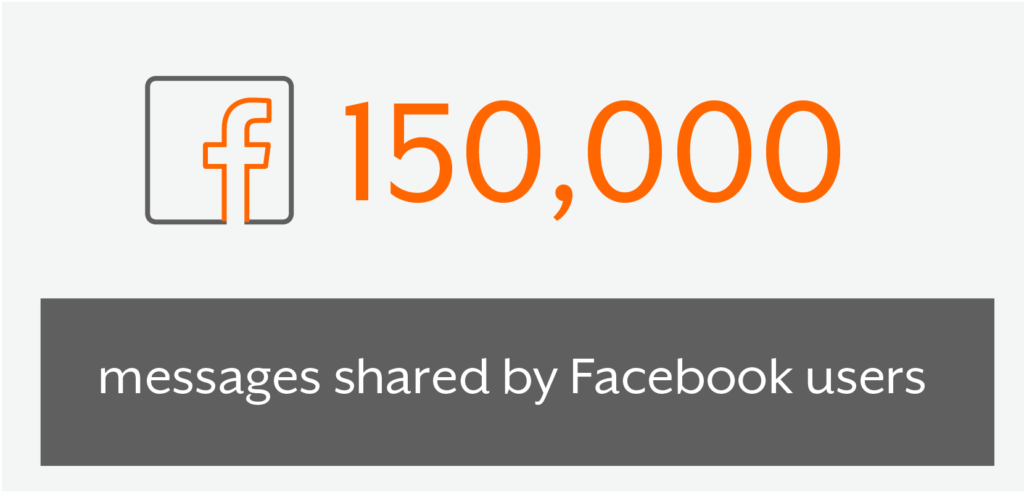
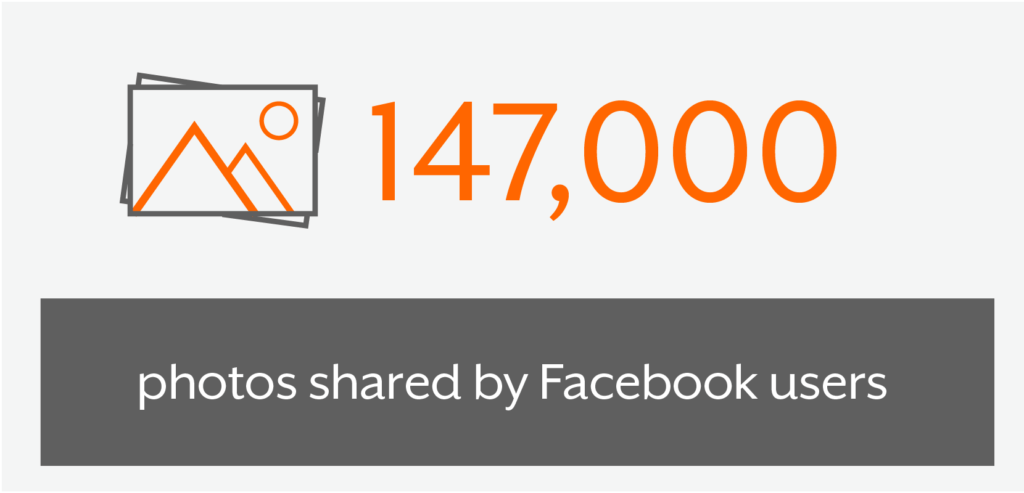

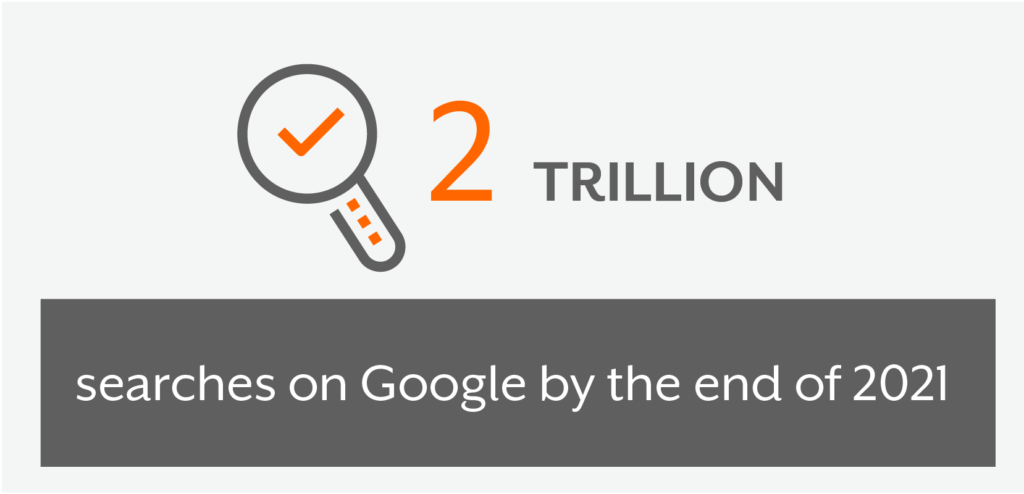
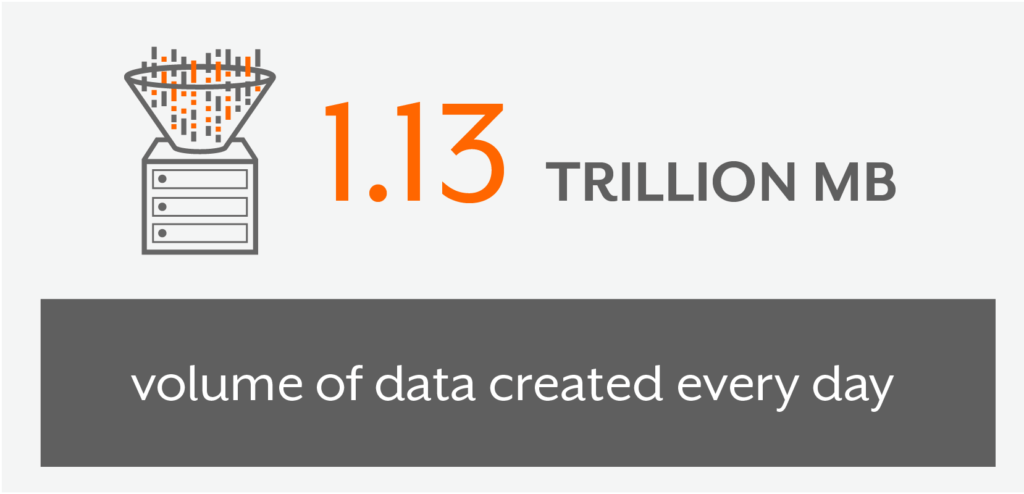
Andre, L. (2021, June 15). 53 important statistics about how much data is created every day. Financesonline.com. Retrieved July 12, 2022, from https://financesonline.com/how-much-data-is-created-every-day/
So, How do GDBs Solve the Volume Problem?
GDBs are specifically designed to deal with the explosion of data and mine for timely and accurate insights within large data sets. This is achieved by modeling data in the form of a graph, where nodes store data entities (people, products, etc.) and edges store the relationships between them. For example, in a social network, a user’s independent attributes such as name, birthday and email are located on the nodes while relational attributes such as associations, friend status and job information lie on the edges.
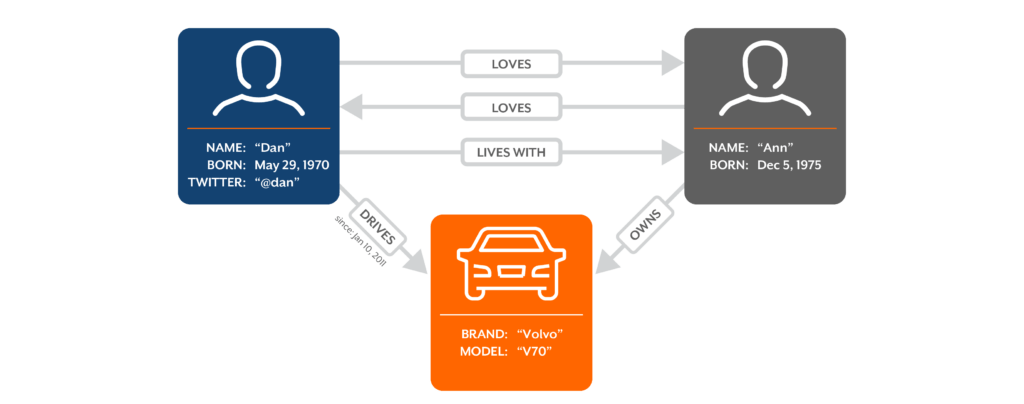
This approach provides a granular representation of relational data where the direction of an edge infers the type of relationship. For instance, relationships from node A to B form a unidirectional edge while a relationship between both A and B yield an edge that’s bidirectional. This distinction defines graph traversal and provides a means to describe complex relationships that would prove challenging in a traditional database.
From Graphs to Insights
Modeling data as a graph provides a robust representation of relational data in which graph theory may be applied to gain deep insights that traditional relational databases cannot. This is achieved by analyzing how the edges are connected. For example, one can traverse between two nodes to learn how they influence each other. Additionally, entire clusters of connected nodes, known as communities, may be analyzed to study entire demographics.
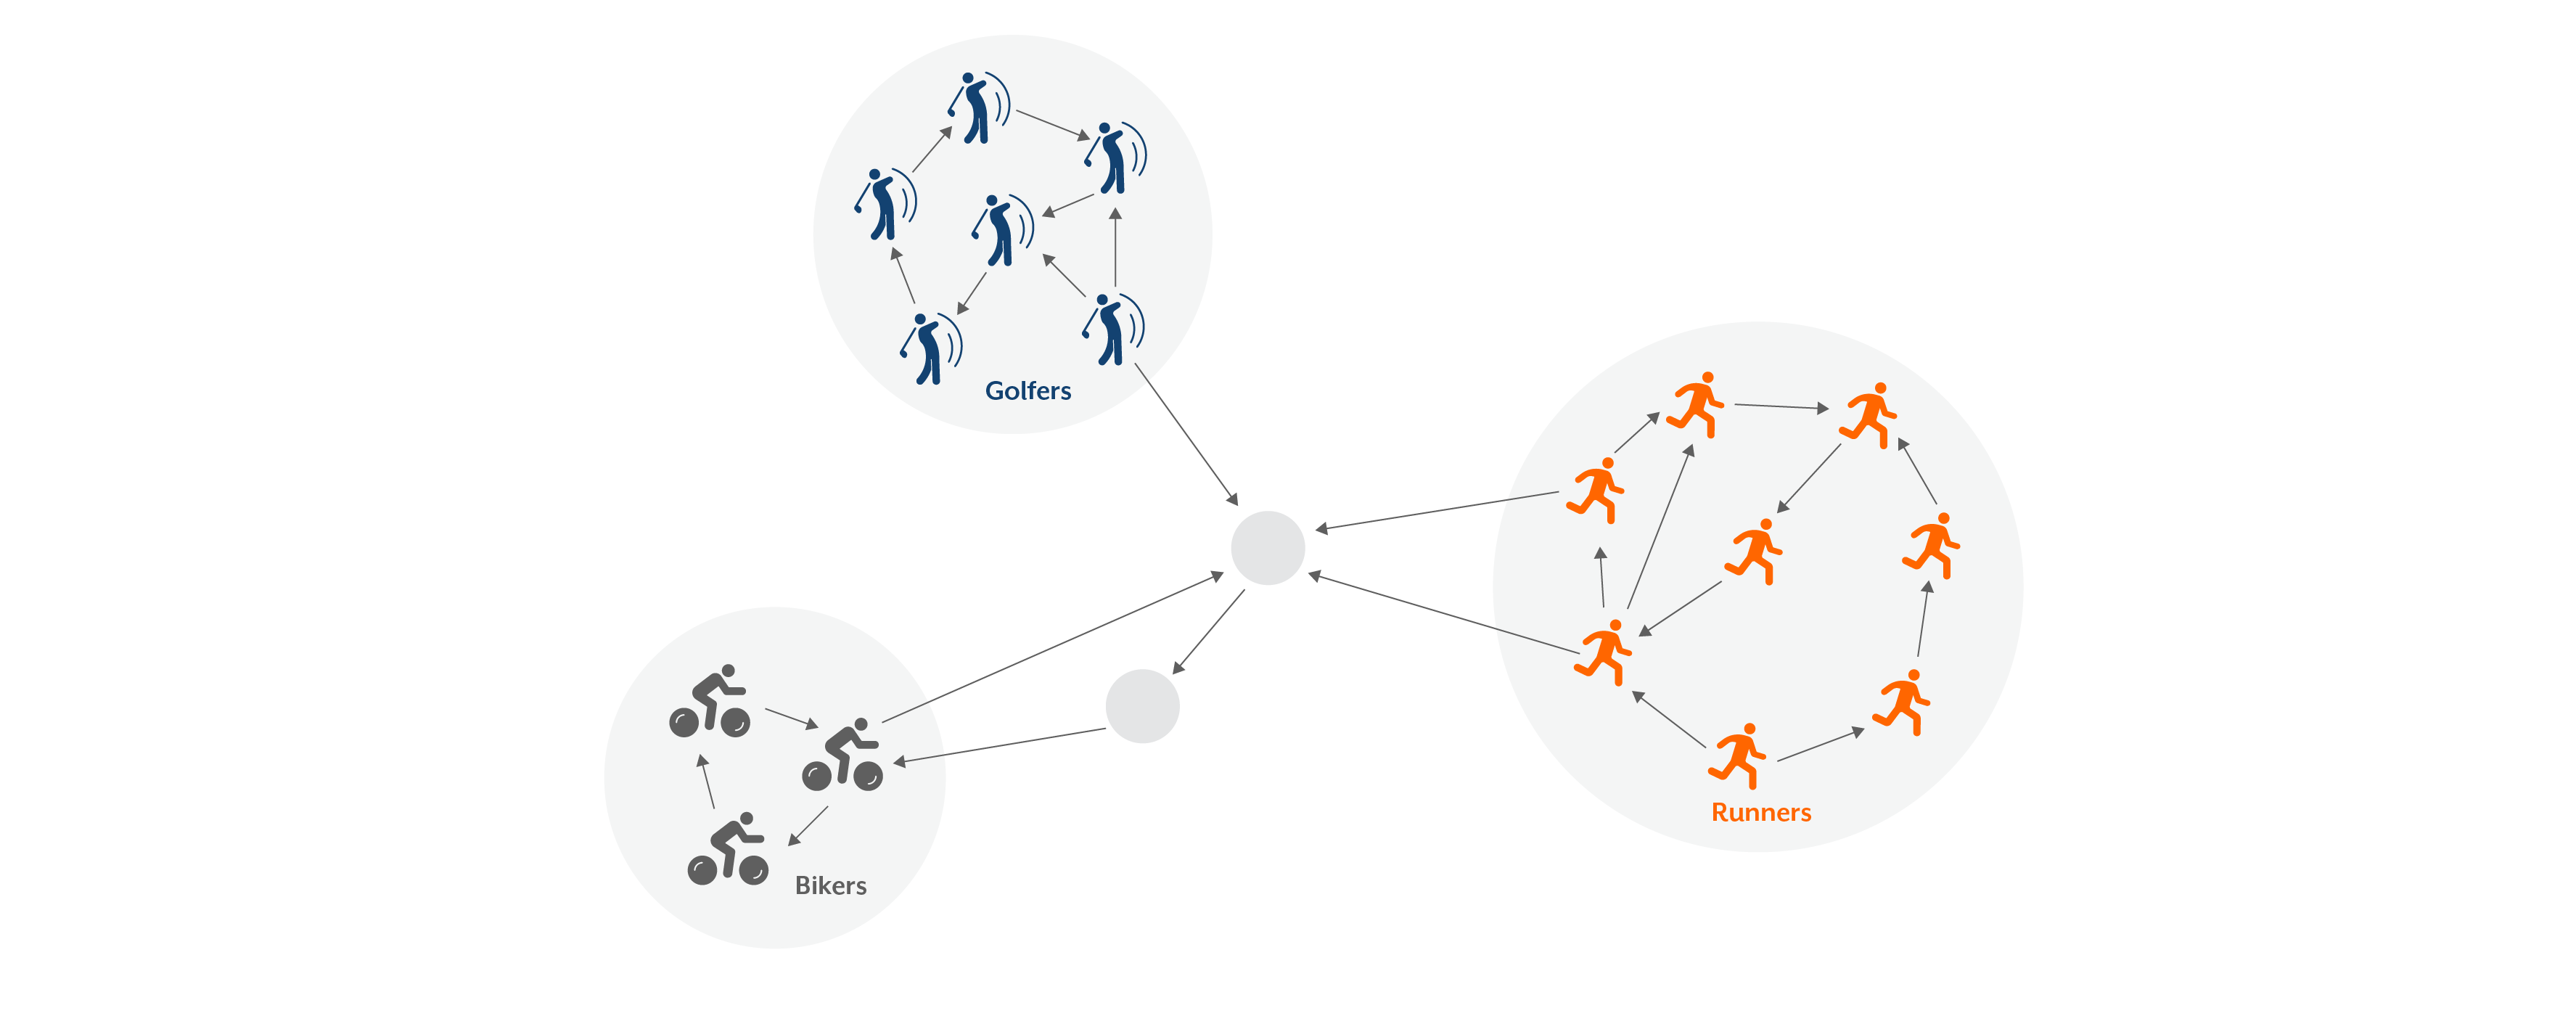
Now consider Marketing. Marketing is all about relationships – the relationship between customers and products, customers and each other, customers and their transaction history, customers and web click streams, etc. Leveraging the power of a graph, businesses can quickly (or in real-time) look at customers that visited their product page and the ones that followed through with a transaction, which can provide traceability and insights into user experience and behavior. Marketing campaigns can be tuned to target specific points along a customer’s journey to drive revenue and avoid multiple trial and errors.
Still not convinced? Wish to dig in more? Let us validate through specific examples. Pick the industry that interests or pertains to you and let us walk through the mechanics of a GDB.
Click on the industry example below to see how GraphDB can drive business value:
Financial criminals are always linked together by some type of relationship – whether they are tied to a fake bank account, other criminals, or they “coincidentally” share the same information with other financial customers. Utilizing a graph database can help detect financial fraud and show any overlapping customers that may share the same information, such as social security number, email addresses, passwords, or addresses.
For example, a customer’s transaction data forms a clique where most transactions are between recurring parties. With a graph, one may watch how this community changes to identify outliers. For instance, if an edge to an outside node is added, one can analyze the new node and determine if the transaction is legitimate.
Having professional experience with this use case, health care is a great industry to utilize graph databases. Healthcare is based on the relationship between people and provided services or goods to treat an illness. Using a graph database, businesses can analyze the relationships between people and the provided care they received, which can help answer questions such as, did all patients have the same outcome for the same provided care? For those that had a different response, are there shared commonalities between them? Is one demographic responding more positively to a certain provided service versus the other demographics? Being able to answer these questions will provide better insights into what type of service is needed to improve the health of their patients.
In today’s day in age consumer media has evolved into the era of influencers. For instance, countless sponsorships are made between brands and streamers, raking in millions of revenues as well as good brand publicity. With the power of GDBs one could identify the influential products and people within your data to give your marketing team the advantage.
 In graph theory a special type of graph exists known as an ego network. Aptly named, the ego network is a graph where all nodes within the community are connected to one central node. Examples include a YouTube creator and their subscribers as well as a brand and their loyal customers. Therefore, by leveraging the power of a GDB identifying your most influential products/people becomes trivial, leading to powerful insights with unprecedented haste. For more information on how to utilize GDB, contact Infinitive today.
At Infinitive, we help organizations get the value out of their data by modeling large volumes of data to provide insights into user experience and behavior. If your organization is looking to drive revenue and increase costs, start a conversation with our experts about GDB today.